

代码拉取完成,页面将自动刷新


This Flutter package provides a Pie Chart Widget with cool animation.
More discussions on Discord: https://discord.gg/7byeCn7MGF
Live Demo: https://apgapg.github.io/pie_chart/

In the dependencies: section of your pubspec.yaml, add the following line:

dependencies:
  pie_chart: <latest version>
import 'package:pie_chart/pie_chart.dart';
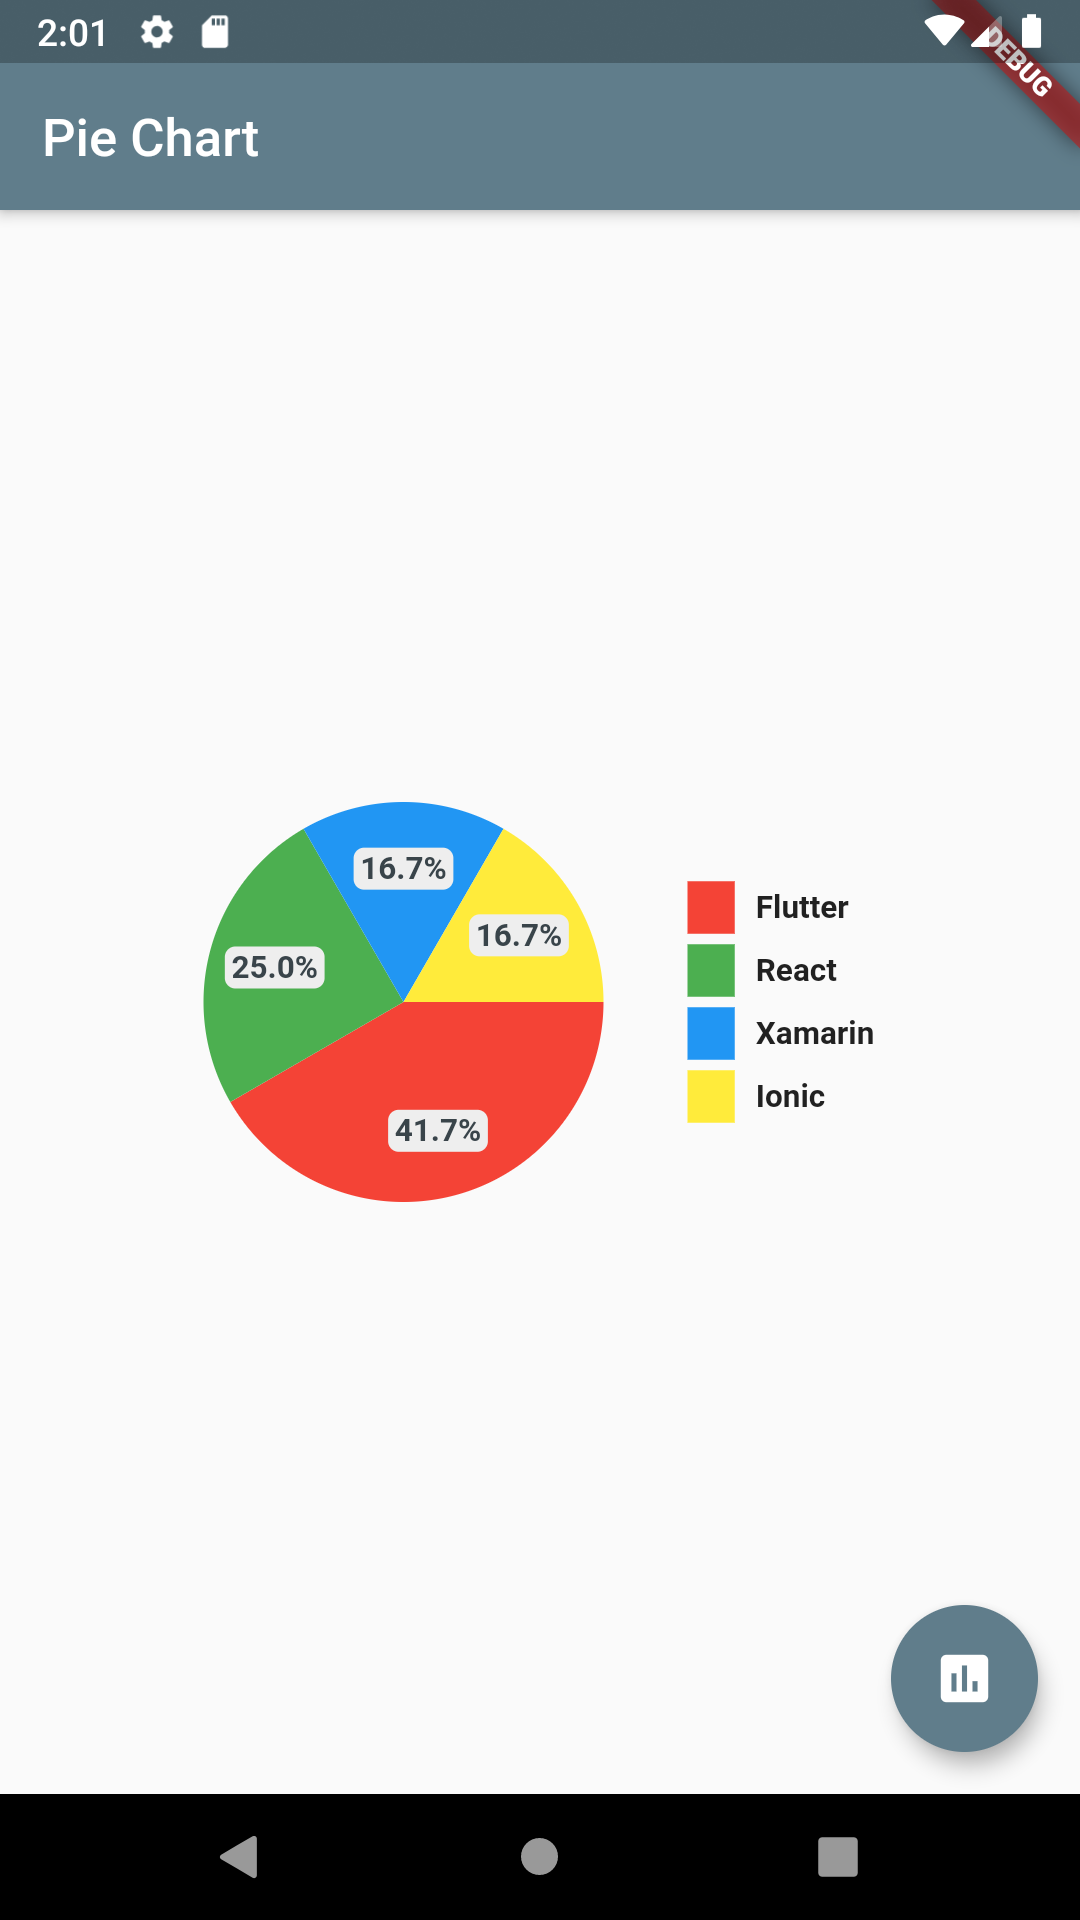
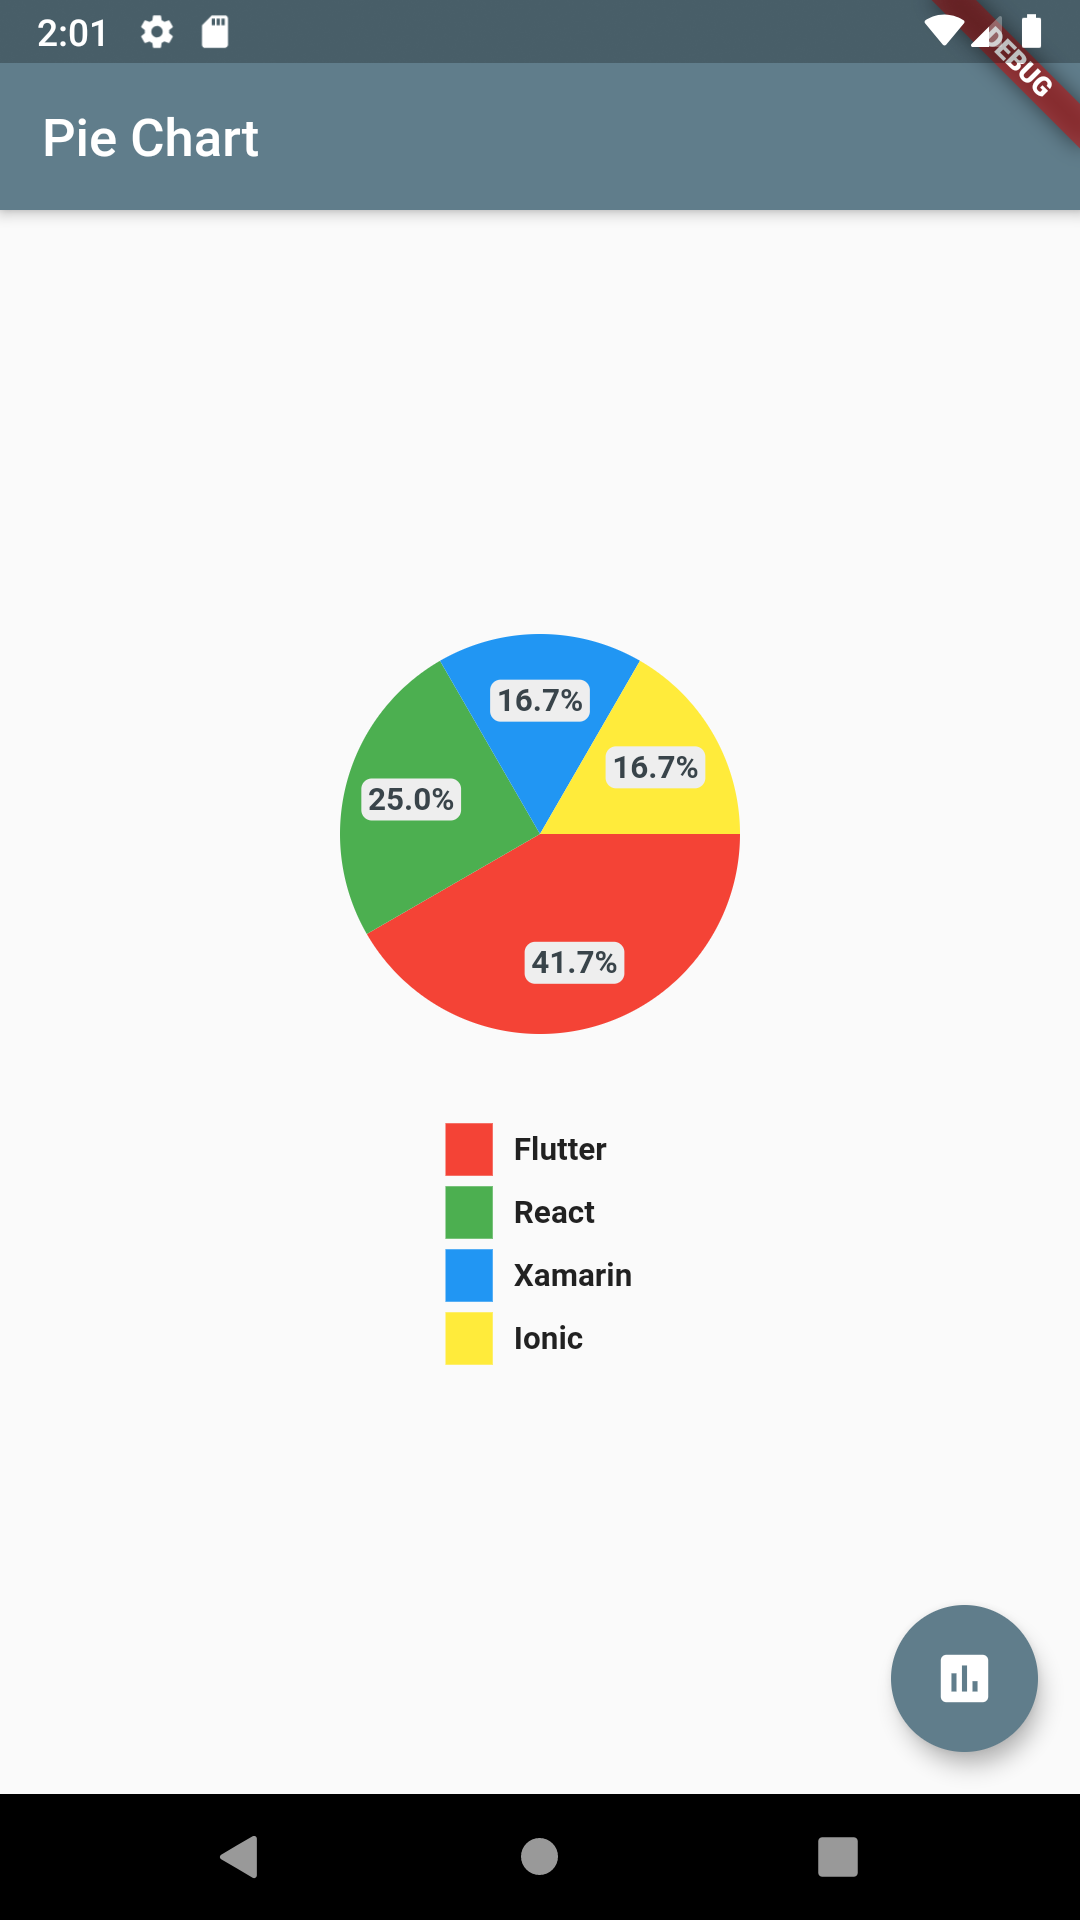
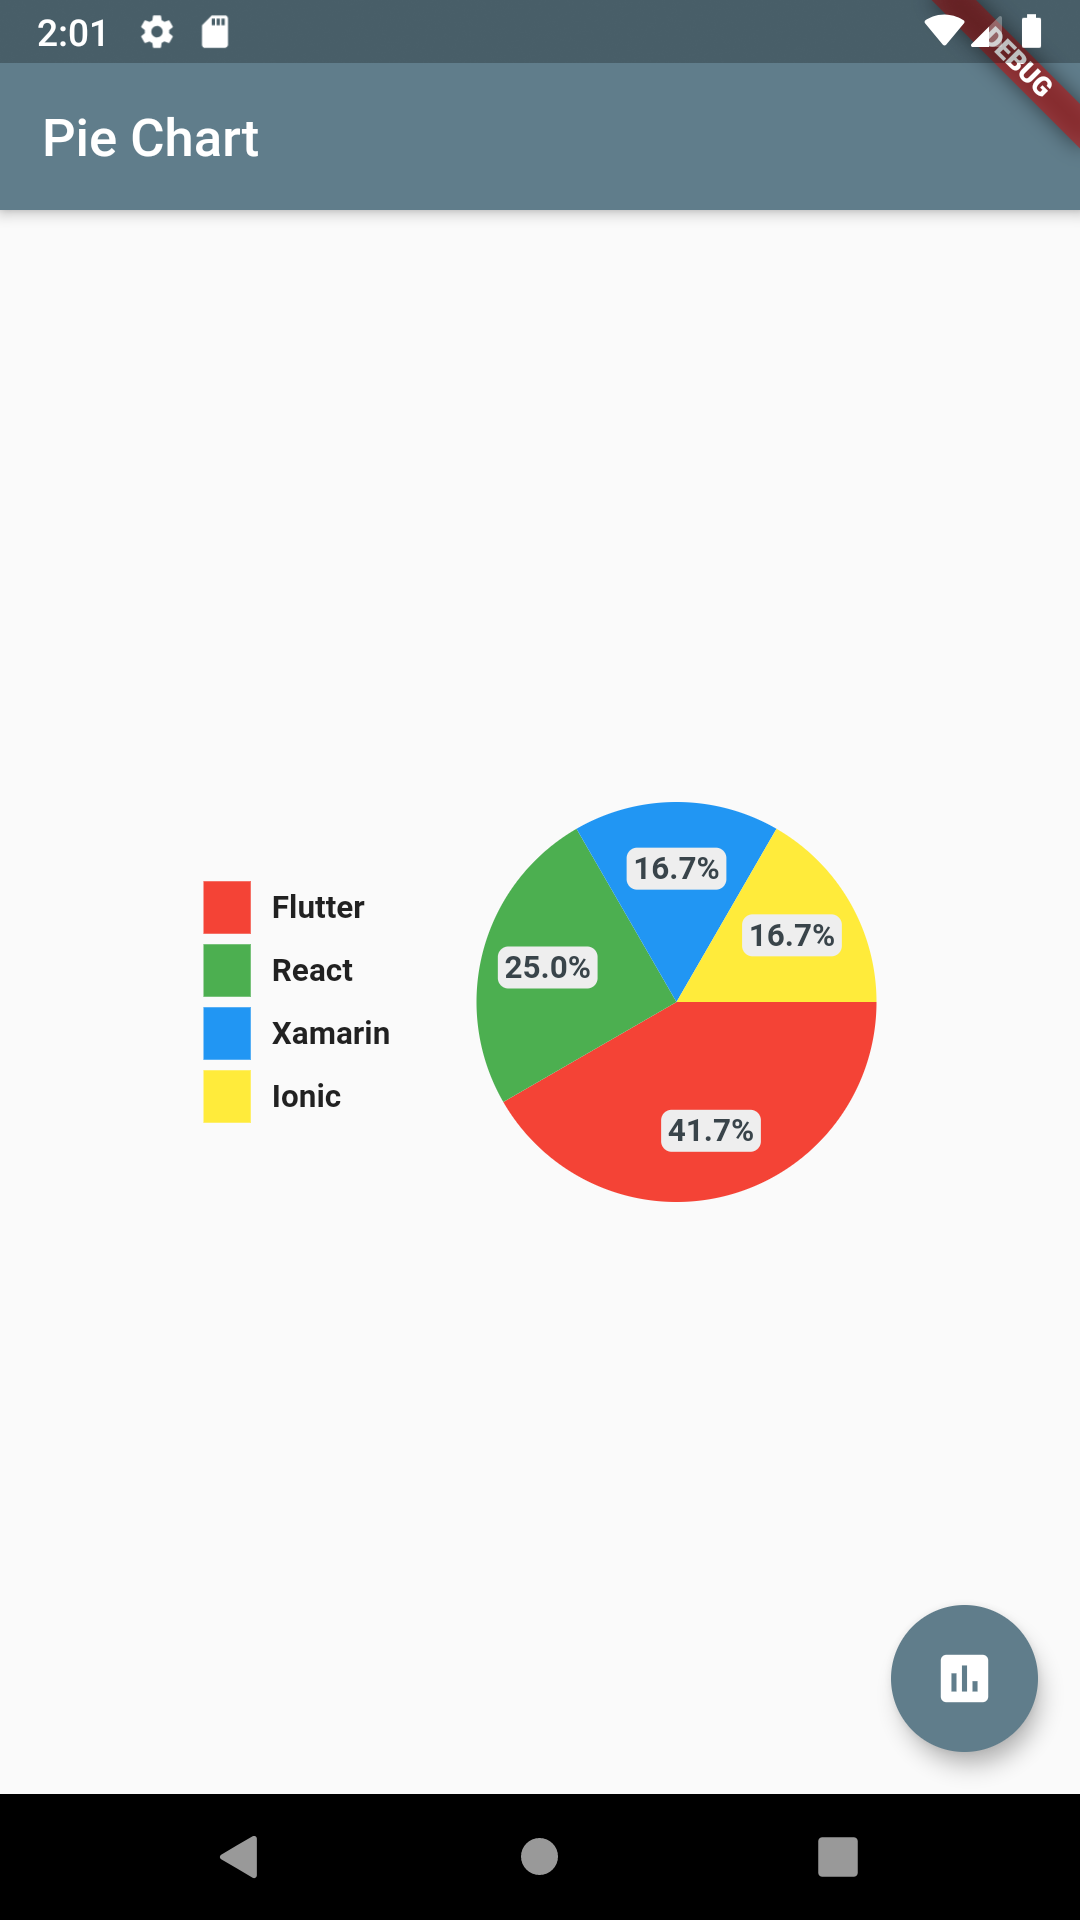
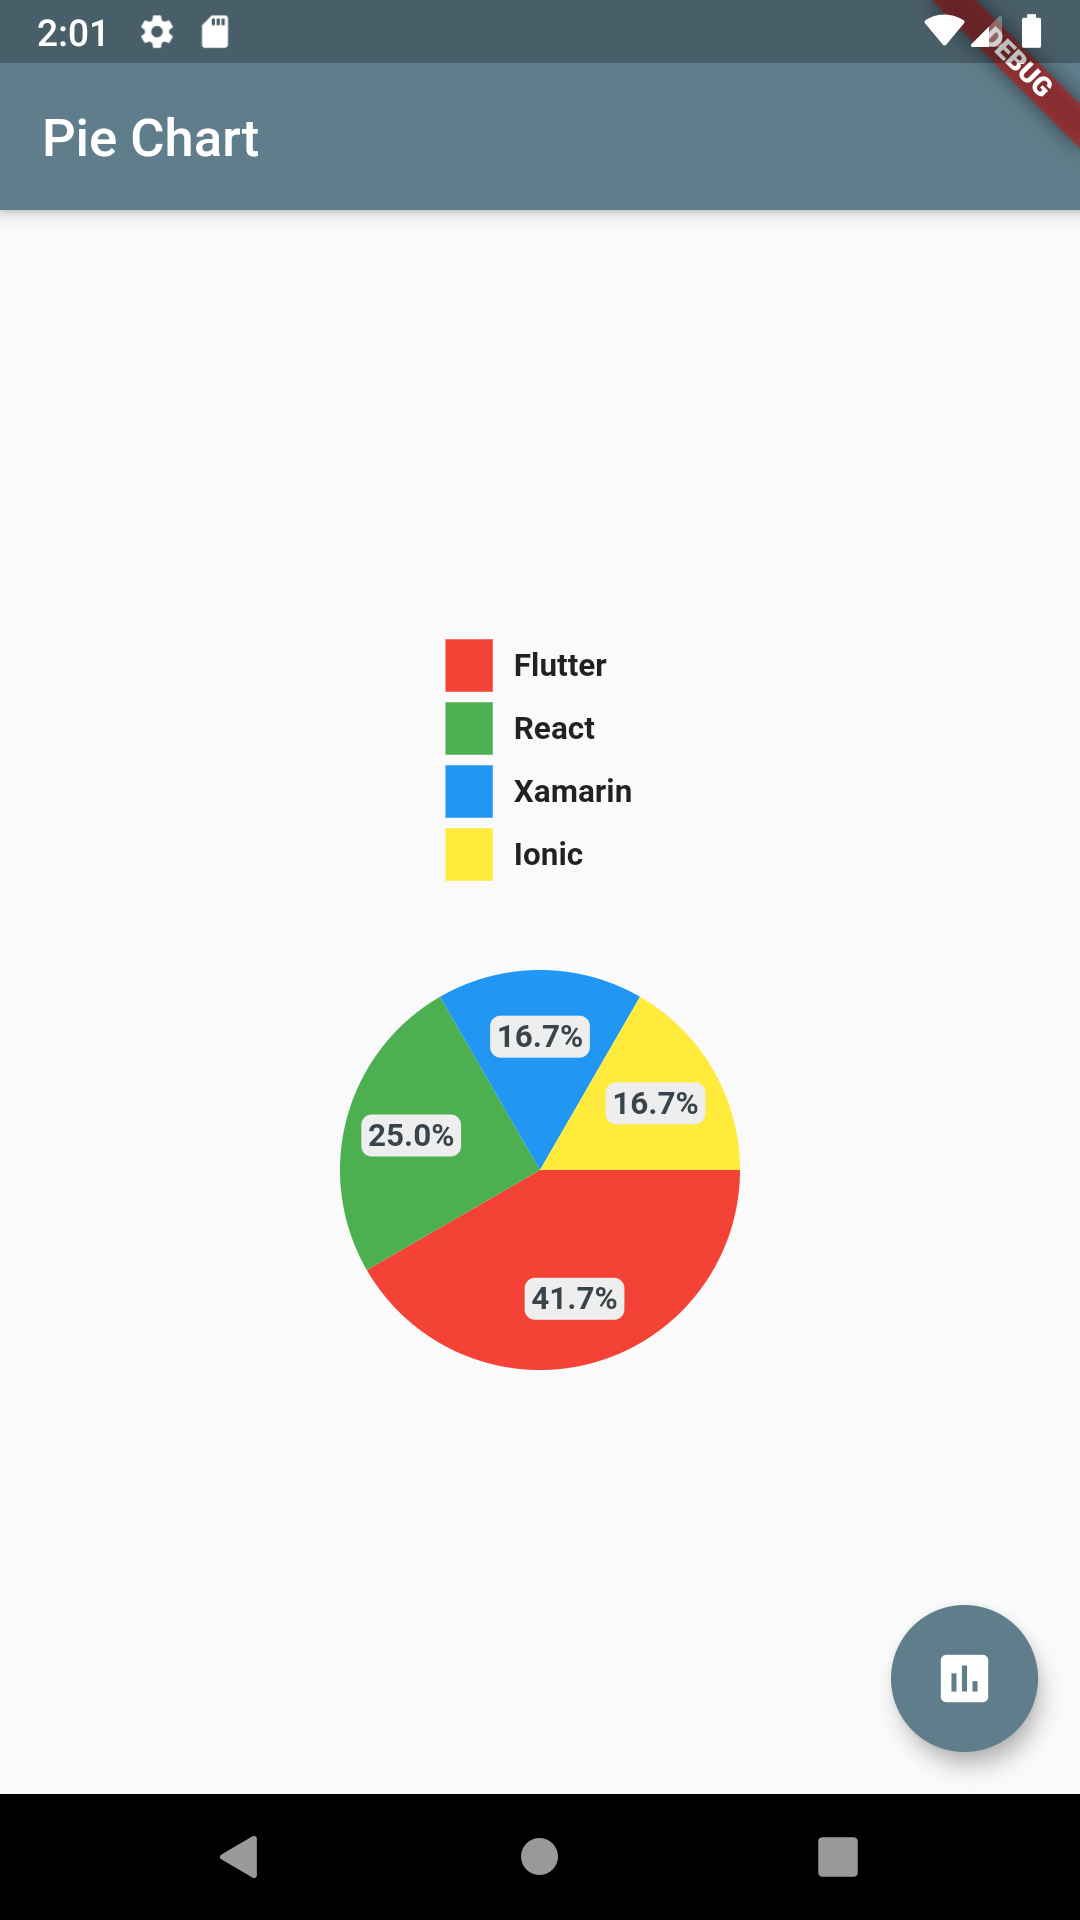
Map<String, double> dataMap = {
    "Flutter": 5,
    "React": 3,
    "Xamarin": 2,
    "Ionic": 2,
  };
PieChart(dataMap: dataMap)
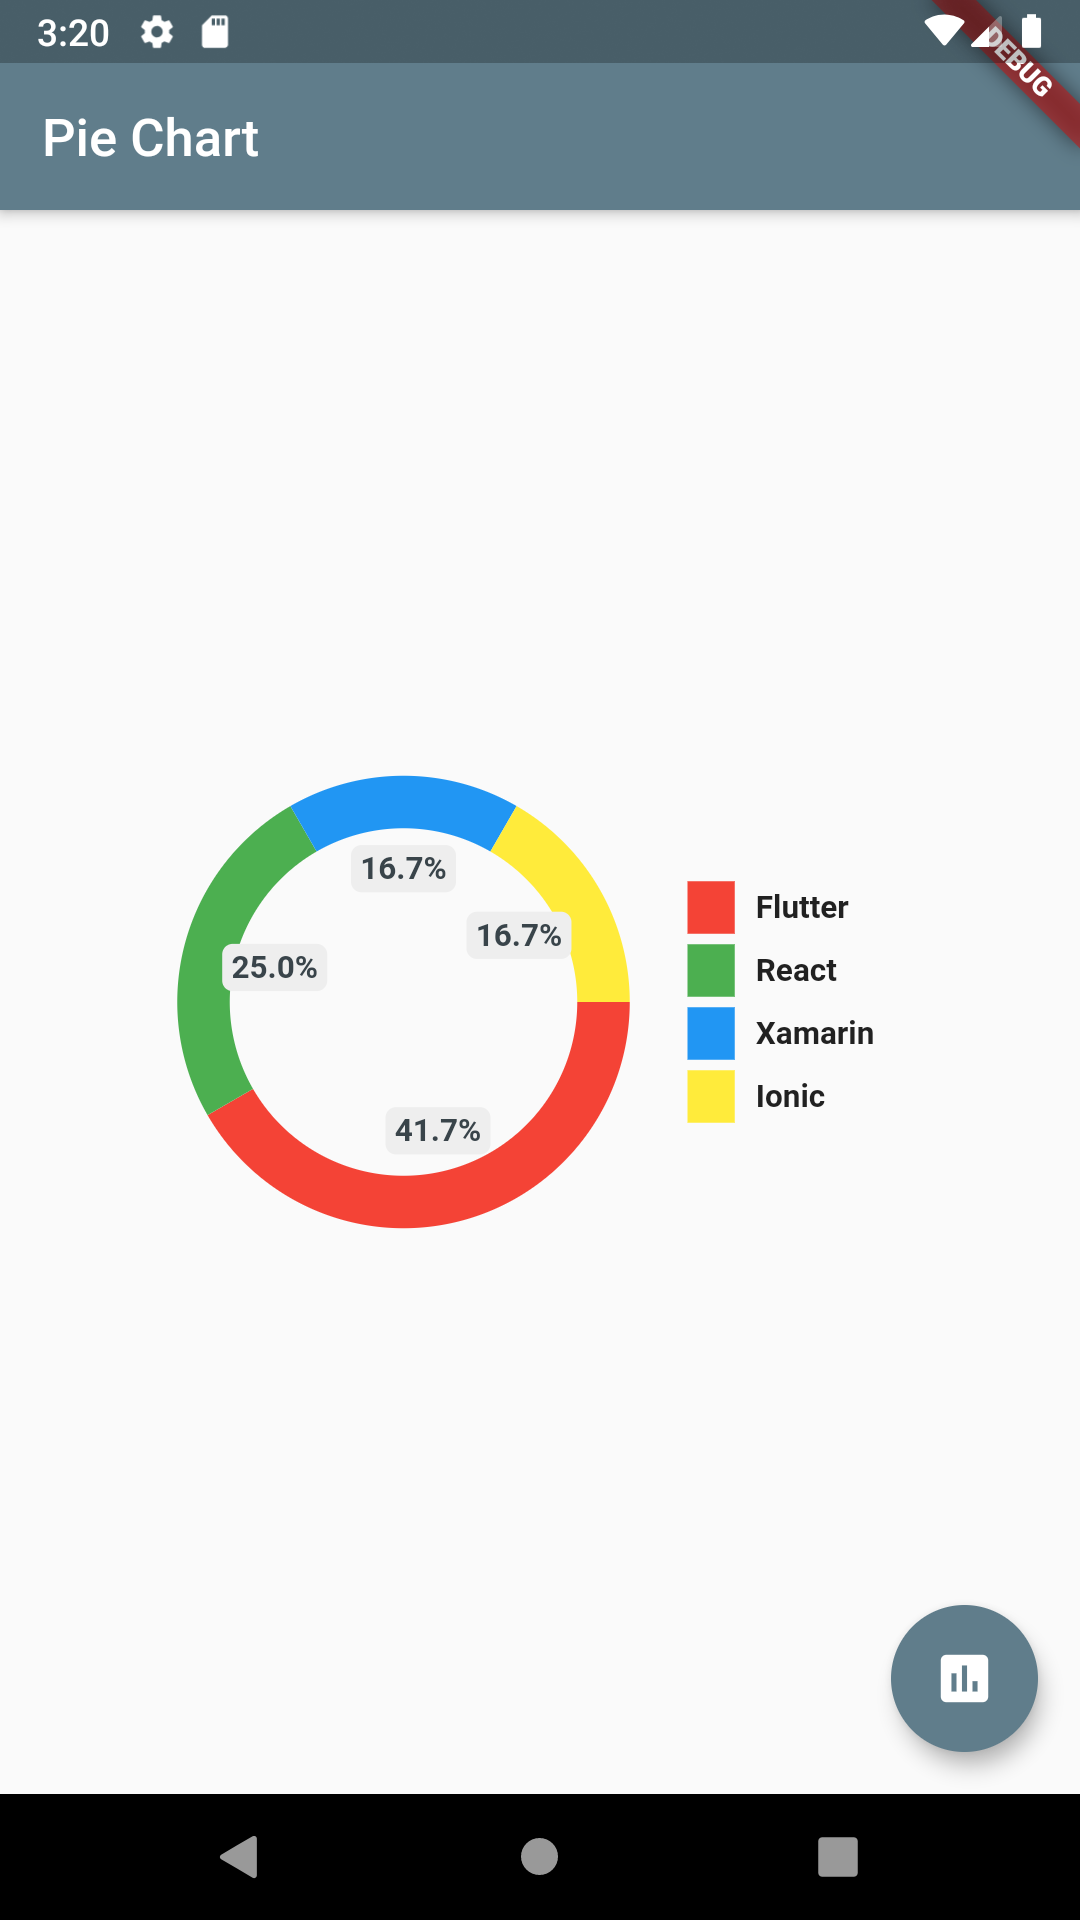
PieChart(
      dataMap: dataMap,
      animationDuration: Duration(milliseconds: 800),
      chartLegendSpacing: 32,
      chartRadius: MediaQuery.of(context).size.width / 3.2,
      colorList: colorList,
      initialAngleInDegree: 0,
      chartType: ChartType.ring,
      ringStrokeWidth: 32,
      centerText: "HYBRID",
      legendOptions: LegendOptions(
        showLegendsInRow: false,
        legendPosition: LegendPosition.right,
        showLegends: true,
        legendShape: _BoxShape.circle,
        legendTextStyle: TextStyle(
          fontWeight: FontWeight.bold,
        ),
      ),
      chartValuesOptions: ChartValuesOptions(
        showChartValueBackground: true,
        showChartValues: true,
        showChartValuesInPercentage: false,
        showChartValuesOutside: false,
        decimalPlaces: 1,
      ),
      // gradientList: ---To add gradient colors---
      // emptyColorGradient: ---Empty Color gradient---
    )
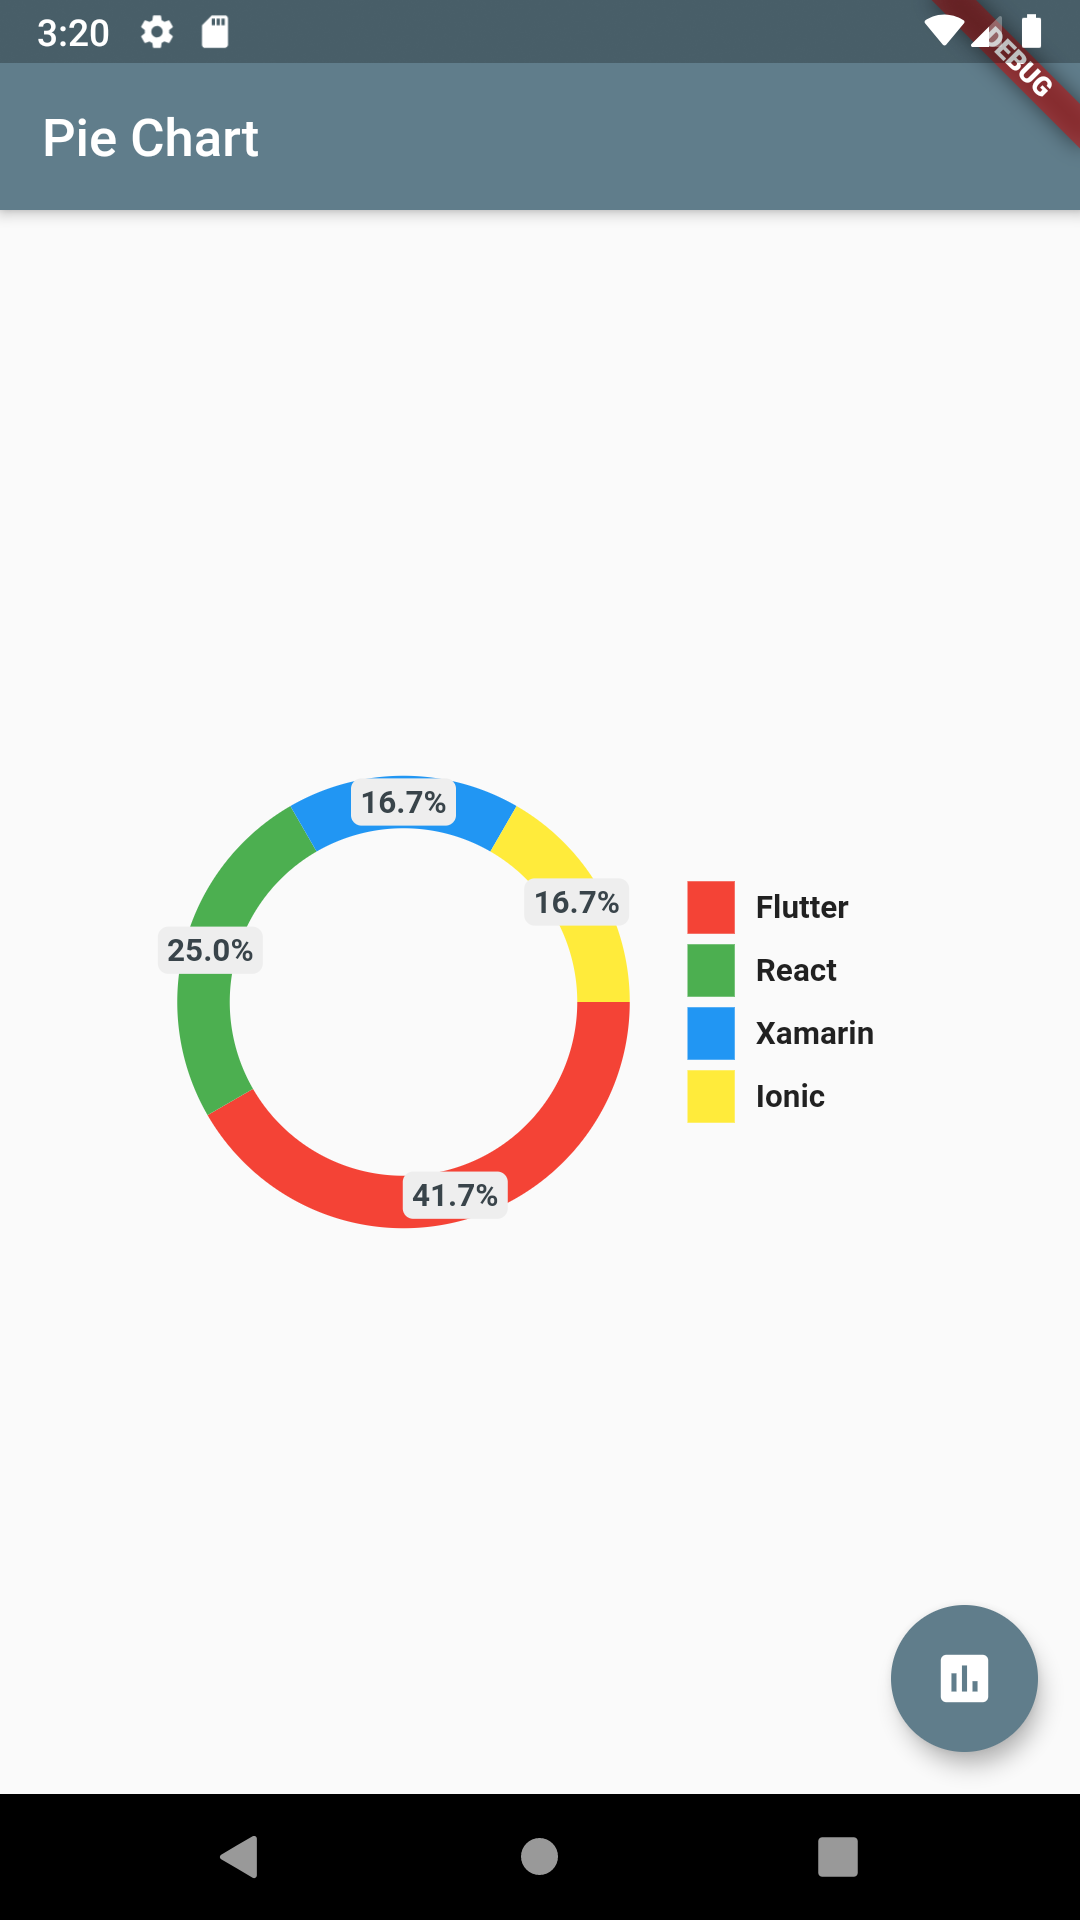
chartValuesOptions: ChartValuesOptions(
  decimalPlaces: 1,
),
chartType: ChartType.ring,
chartType: ChartType.ring,
showChartValuesOutside: true,
Pie Chart supports gradient as colors. Just pass gradientList instead of colorList to add gradient to chart colors.
final gradientList = <List<Color>>[
  [
    Color.fromRGBO(223, 250, 92, 1),
    Color.fromRGBO(129, 250, 112, 1),
  ],
  [
    Color.fromRGBO(129, 182, 205, 1),
    Color.fromRGBO(91, 253, 199, 1),
  ],
  [
    Color.fromRGBO(175, 63, 62, 1.0),
    Color.fromRGBO(254, 154, 92, 1),
  ]
];

// Pass gradient to PieChart
gradientList: gradientList,
emptyColorGradient: [
 Color(0xff6c5ce7),
 Colors.blue,
],
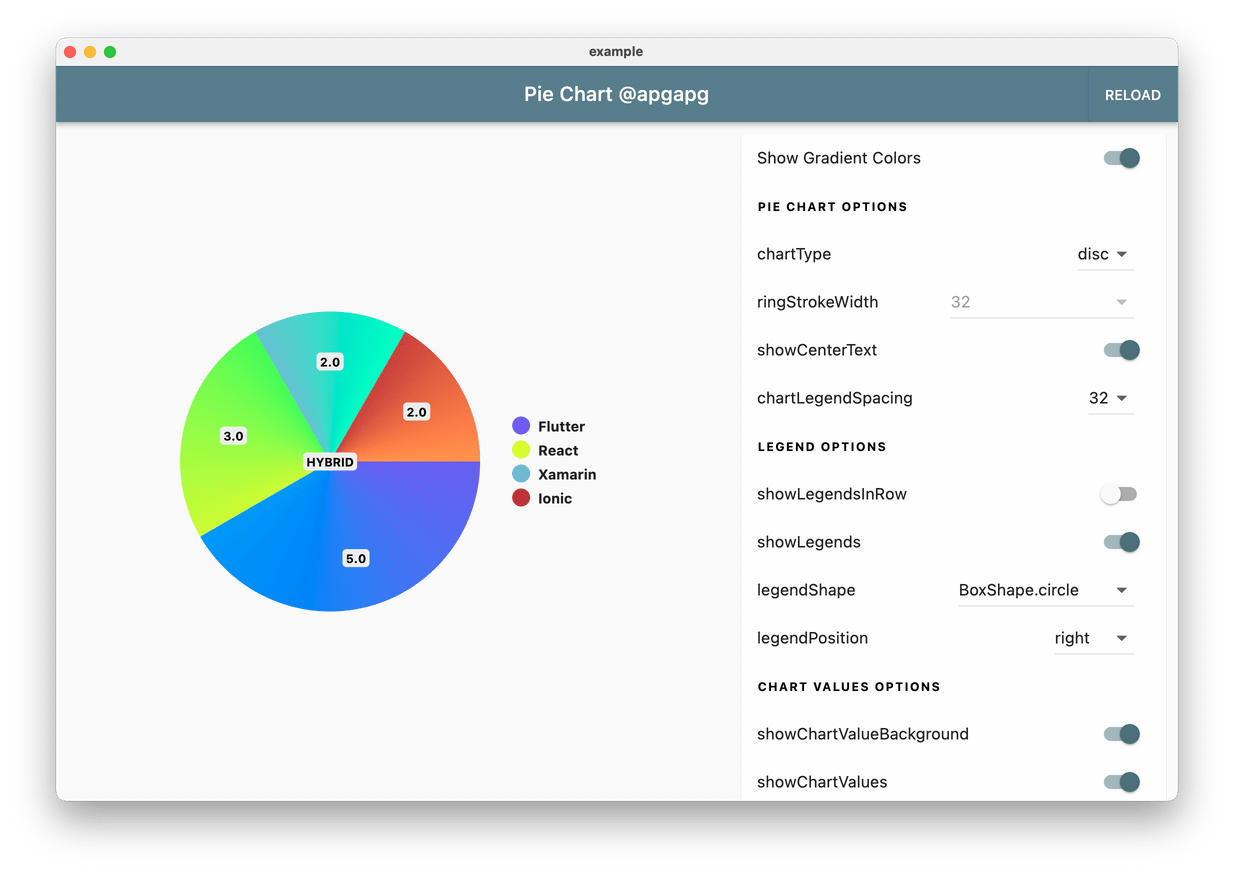
Add a base pie-chart color via:
baseChartColor: Colors.grey
Full code:
class HomePage2 extends StatelessWidget {
  HomePage2({Key? key}) : super(key: key);

  final dataMap = <String, double>{
    "Flutter": 5,
  };

  final colorList = <Color>[
    Colors.greenAccent,
  ];

  @override
  Widget build(BuildContext context) {
    return Scaffold(
      appBar: AppBar(
        title: Text("Pie Chart 1"),
      ),
      body: Container(
        padding: EdgeInsets.symmetric(horizontal: 16),
        child: PieChart(
          dataMap: dataMap,
          chartType: ChartType.ring,
          baseChartColor: Colors.grey[300]!,
          colorList: colorList,
        ),
      ),
    );
  }
}
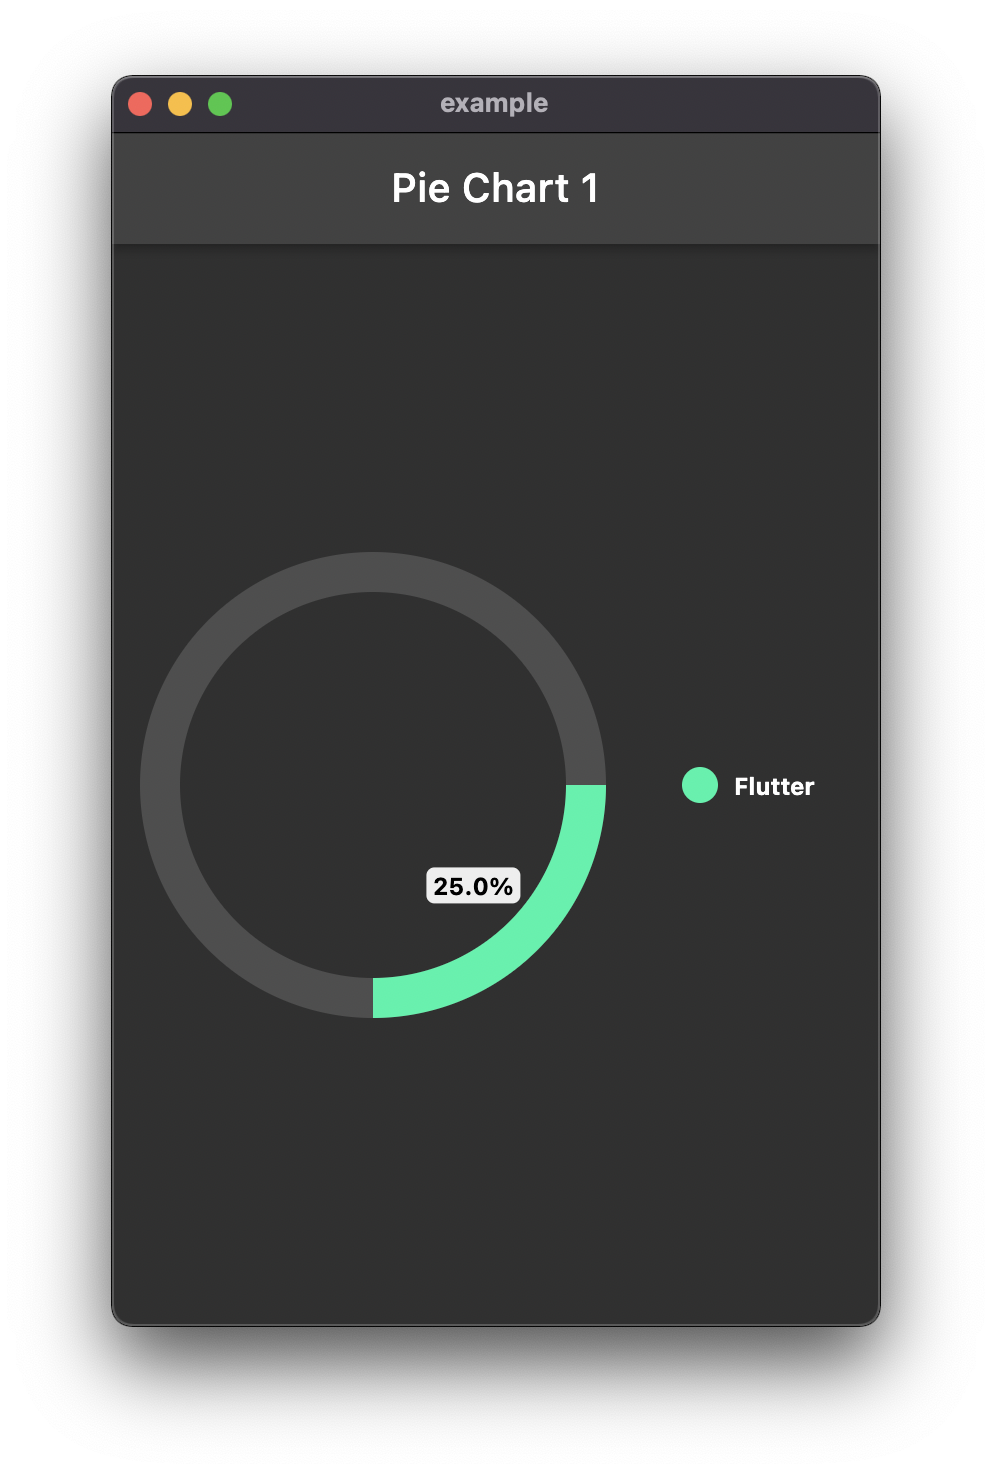
To show chart arcs based on your total value, add totalValue option.
class HomePage2 extends StatelessWidget {
  HomePage2({Key? key}) : super(key: key);

  final dataMap = <String, double>{
    "Flutter": 5,
  };

  final colorList = <Color>[
    Colors.greenAccent,
  ];

  @override
  Widget build(BuildContext context) {
    return Scaffold(
      appBar: AppBar(
        title: Text("Pie Chart 1"),
      ),
      body: Container(
        padding: EdgeInsets.symmetric(horizontal: 16),
        child: PieChart(
          dataMap: dataMap,
          chartType: ChartType.ring,
          baseChartColor: Colors.grey[50]!.withOpacity(0.15),
          colorList: colorList,
          chartValuesOptions: ChartValuesOptions(
            showChartValuesInPercentage: true,
          ),
          totalValue: 20,
        ),
      ),
    );
  }
}
 Create Flutter Json Table from json map directly.
 Flutter Search Widget for selecting an option from list.
 Flutter Animating Location Pin Widget providing Animating Location Pin Widget which can be used while fetching device location.
 Showcase My Portfolio: Ayush P Gupta on Playstore.
 Flutter App which allows reading/uploading short stories.
此处可能存在不合适展示的内容,页面不予展示。您可通过相关编辑功能自查并修改。
如您确认内容无涉及 不当用语 / 纯广告导流 / 暴力 / 低俗色情 / 侵权 / 盗版 / 虚假 / 无价值内容或违法国家有关法律法规的内容,可点击提交进行申诉,我们将尽快为您处理。


